How do we generate a fouling heatmap and calculate the fouling ratio
There is no easy solution to biofouling mapping. But, with precise data and insights into biofouling spreading and growth, visualized through our heatmaps and tracked with fouling ratio metrics, aquaculture experts can reduce cleaning costs by up to 30%. Instead of regularly cleaning the entire nets, our data provides an option to plan cleaning on a need-basis and prevent exponential growth.
In this blog, we explain how we generate heatmap and fouling ratio metrics.
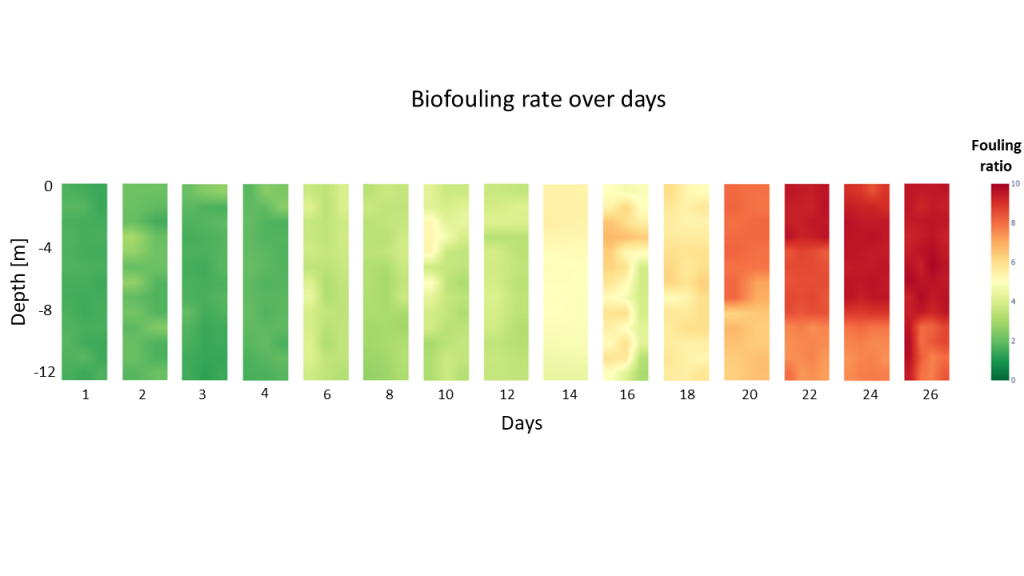
The fouling ratio heatmap represents the entire surface of the fish pen nets – 220 meters in width and 20 meters in depth.
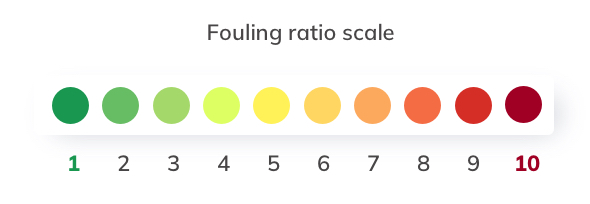
The colors represent a fouling ratio rate on a scale from 1-10. Fouling ratio 1 signifies a clean net, while 10 is a completely overgrown net. The fouling ratio is a metric that strongly correlates with dissolved oxygen(DO) levels in cages compared with DO in the open sea.
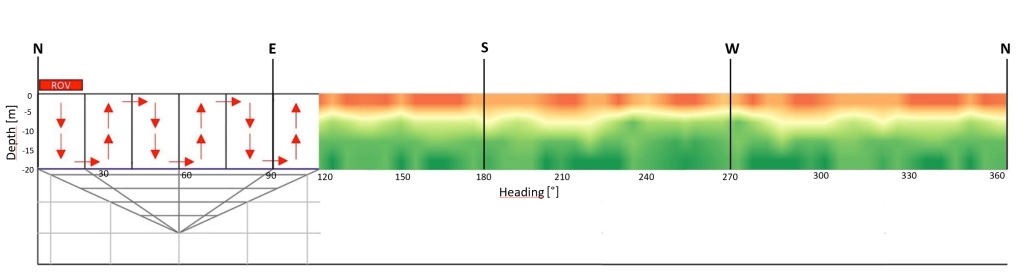
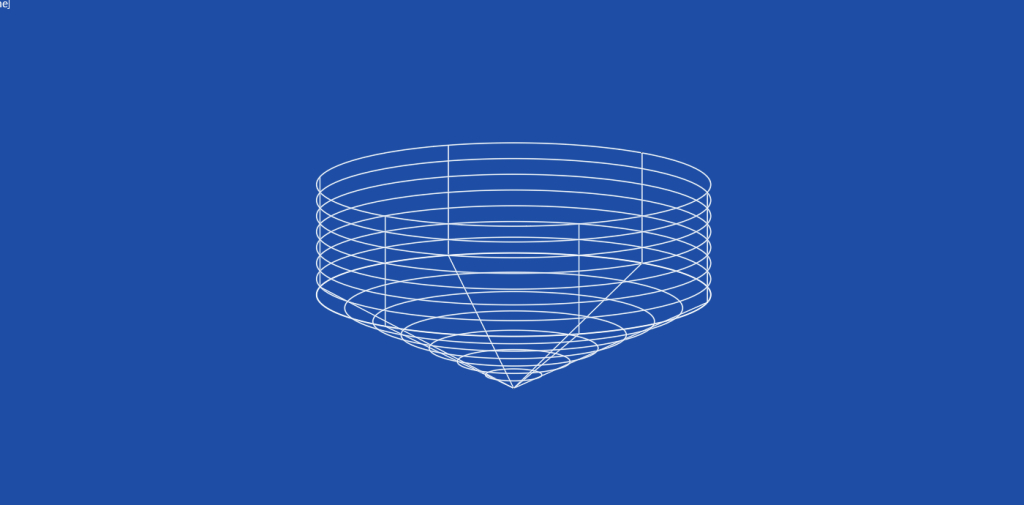
The first step of the video analysis process is geolocating each of the 160.000 photos from a 1:30 hours-long inspection video ( 30 frames/sec).
We use two coordinates – heading and depth. The ability to precisely locate every image also helps us provide 100% inspection coverage service, providing the highest level of certainty in detecting holes’ locations.
Since all steps in our software are fully automatized, video image analysis takes around one hour, providing reports and insights into fish and infrastructure in near-real time.
After attributing position, our algorithm automatically detects the best image for each square meter of the net. In the first round, we work with around 20.000 photos, covering an area of 220 m x 20 m. Later in the process, we chose the sharpest 4400 photos distributed to cover the whole net area.
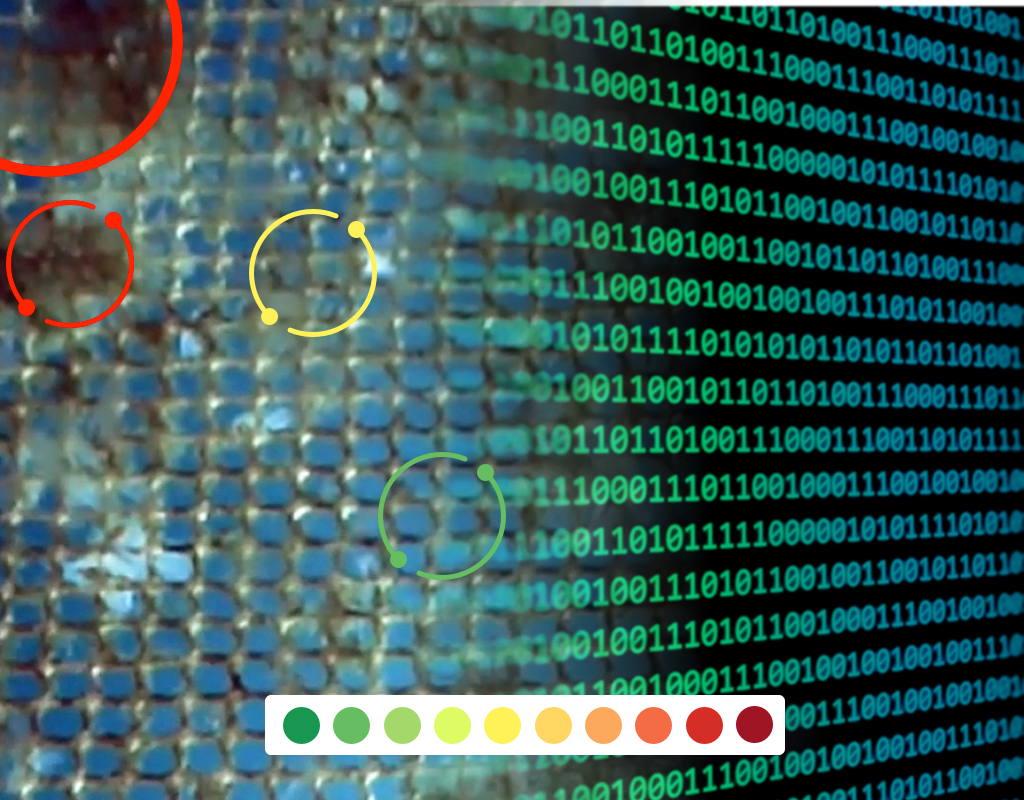
Before calculating the biofouling ratio on each image, our algorithm will automatically remove everything that is not fouling from further analysis – ropes, fish, and parts of the infrastructure.
When we have detected what is (and what isn’t) net, KARMENstudio AI algorithm automatically calculates the biofouling ratio for every square meter of the cages. The biofouling ratio is a metric showing the percentage of the net overgrown with biofouling. It is calculated for every square meter of the net.
After attributing the biofouling ratio for every square meter of the net, the last step in the process is generating the heatmap.
AI video analysis and heatmap generation take around one hour (after initial ML training), providing near real-time insights.
Heatmaps are the guides for your robots or divers, providing an accurate location where to clean. Instead of cleaning the entire nets, which disturbs fish and generates high costs, clean only when and where needed.
Regular monitoring of biofouling development provides historical data that helps you predict when biofouling will spread exponentially to prevent it. Cleaning on a need basis, before fouling spreads, lowers cost and positively impacts fish well-being and infrastructure safety.
KARMENstudio’s data detect which positions are more susceptible to fast overgrowth. By cleaning them on time, the rest of the net stays clean for longer and ensures a significant increase of dissolved oxygen levels in the cage. Heat maps and growth graphs will help you keep an eye on critical places of the net.
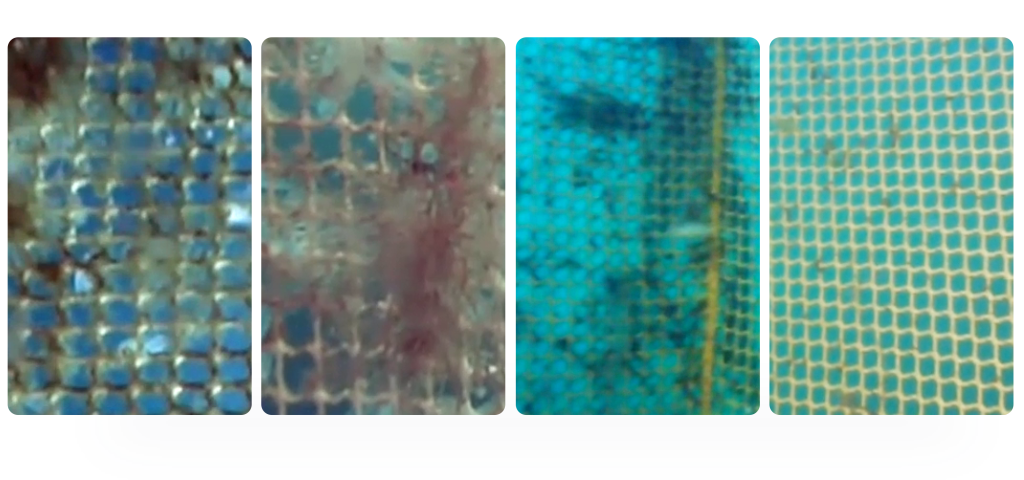
Also, our advanced AI can be trained to detect different kinds of fouling, helping you pick the best anti-fouling intervention.
We analyze only one video to provide several vital metrics.
Using only one video (recorded by any ROV/camera with) to analyze several aquaculture parameters – net holes, fouling, and inspection coverage (did the ROV record 100% of the net), we increase ROI on video recording costs.
If you would like to know more about KARMENstudio’s work, services, and modules, please, contact us – we will gladly answer all your questions and provide additional information.
Get a free demo
Try KARMENstudio for free
Upload a video clip of yours captured by ANY ROV/camera you use.
After receiving your video, we will analyze it and send you a custom report in up to 3 days
You don’t need to sign up or use your credit card!
Contact us